See it live
See the live dashboard at https://eclipse.biterg.io !

The Eclipse dashboard
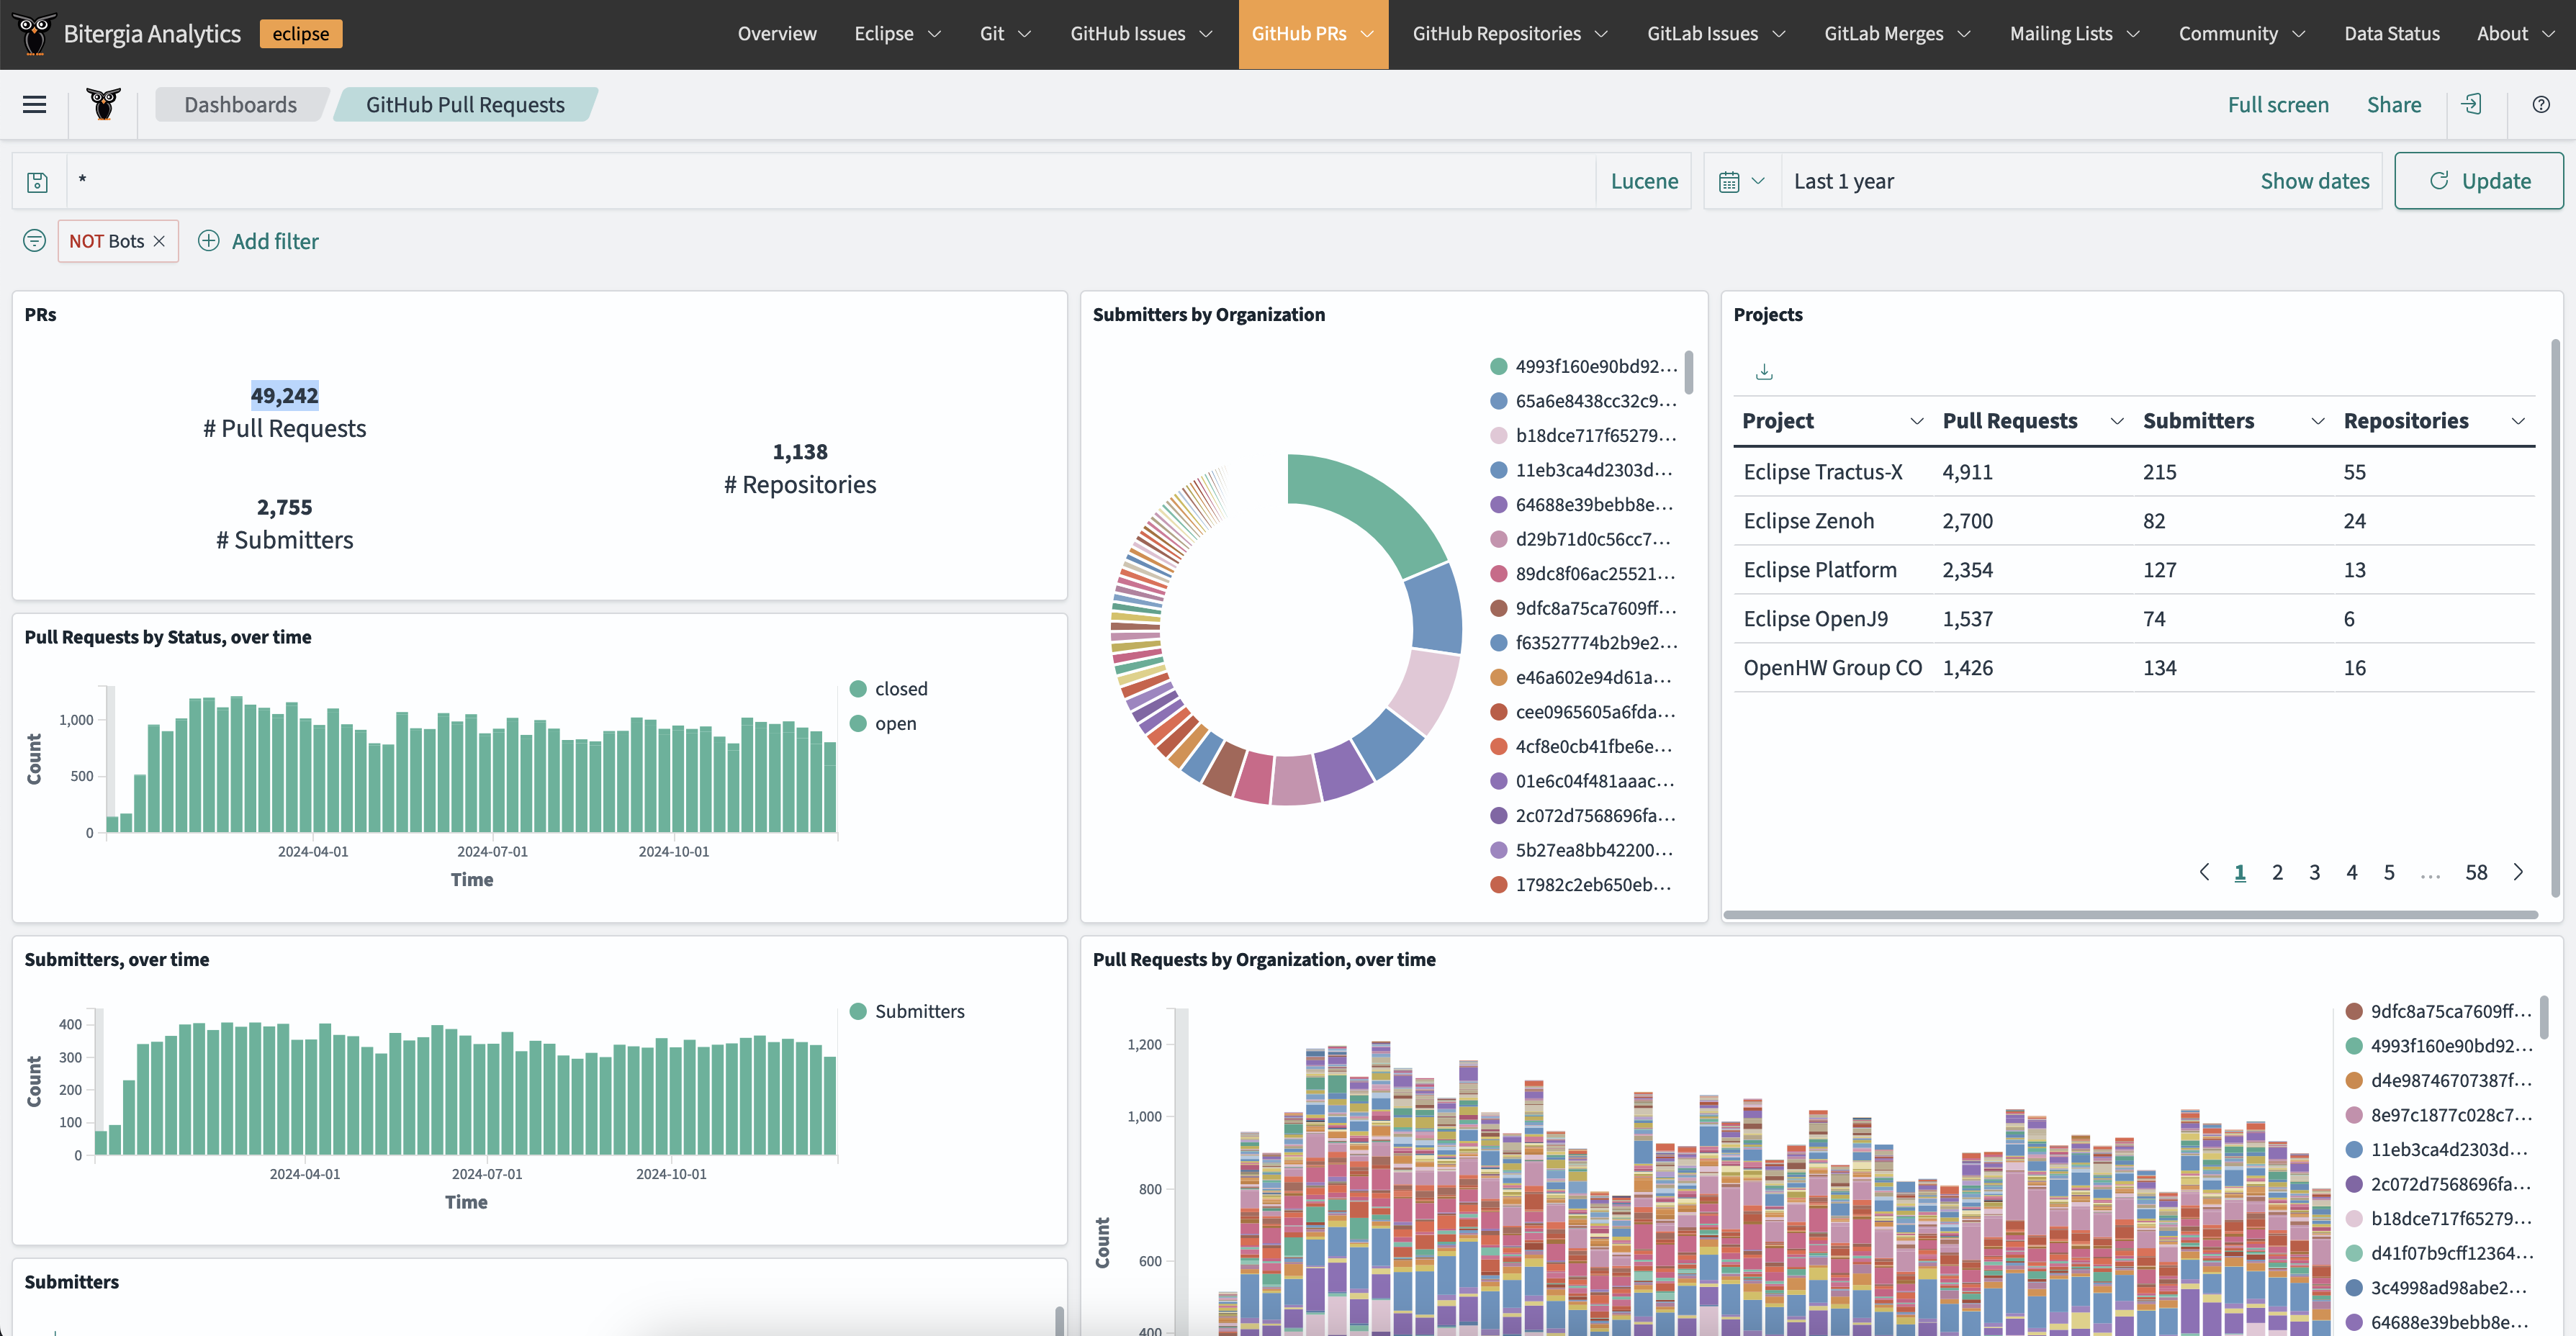
The Bitergia dashboard for Eclipse provides anonymised access to the OpenSearch database. All PII information, like email addresses, login ids or names, are obfuscated for both individuals and organisations.
The instance provides a powerful Kibana-like interface, composed of multiple dashboard and visualisations. We highly recommend to check out the documentation on Bitergia platform to learn how to best make use of it. Note that some functionalities have been disabled for public access. If you somehow need to know about this, please get in touch with Eclipse staff or submit an issue in our Helpdesk .
Our recommended reading list:
For more advanced topics, see:
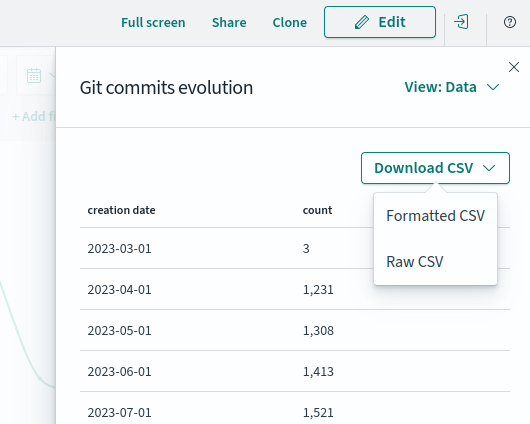
After you have fine-tuned your visualisation (e.g. by selecting a project and time range), you may want to download the specific data related to it. Click on the three dots at the top right on the visualisation, and selection Inspect.

From the Download CSV menu, select one of the two options: Formatted CSV, and Raw CSV. They both hold the exact same information, but the former tries to diplay human-readable data (e.g. formatted dates) while the latter displays raw data (e.g. timestamps).
CSV files are very easy to import in whatever BI or analytics tool is used: Spreadsheets, Pandas, R, Tableau. The best tool being the one you know, you can just use it to read the data and produce reports.
Note that the URL of the CSV file will always be updated. You can use it in executable reports like notebooks to automatically generate up-to-date documents and reporting.
There are a few ways to reuse visualisations (tables, plots, ) from the dashboard, or the full dashboard itself.

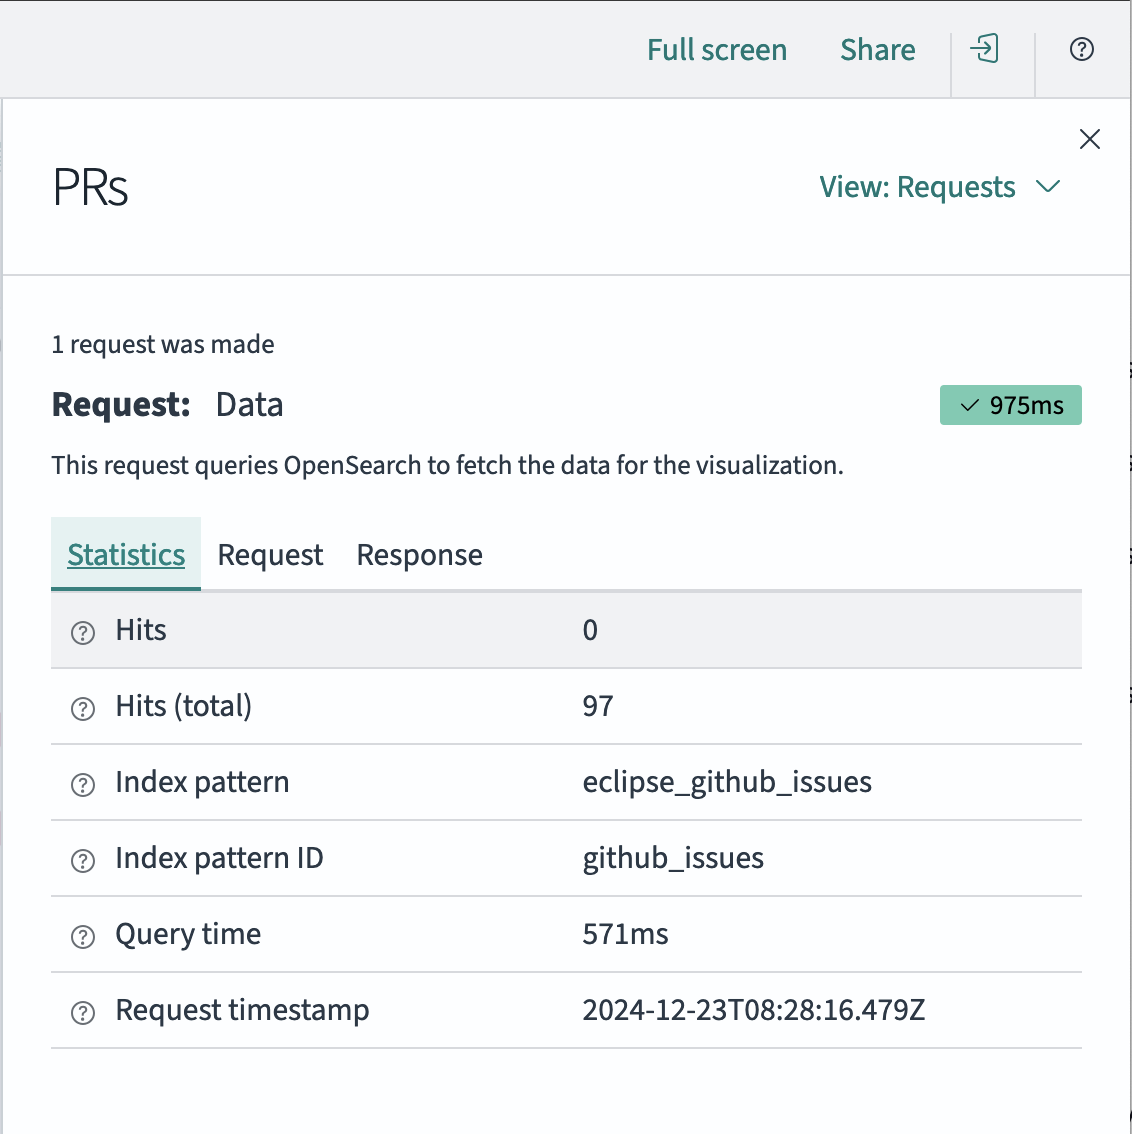
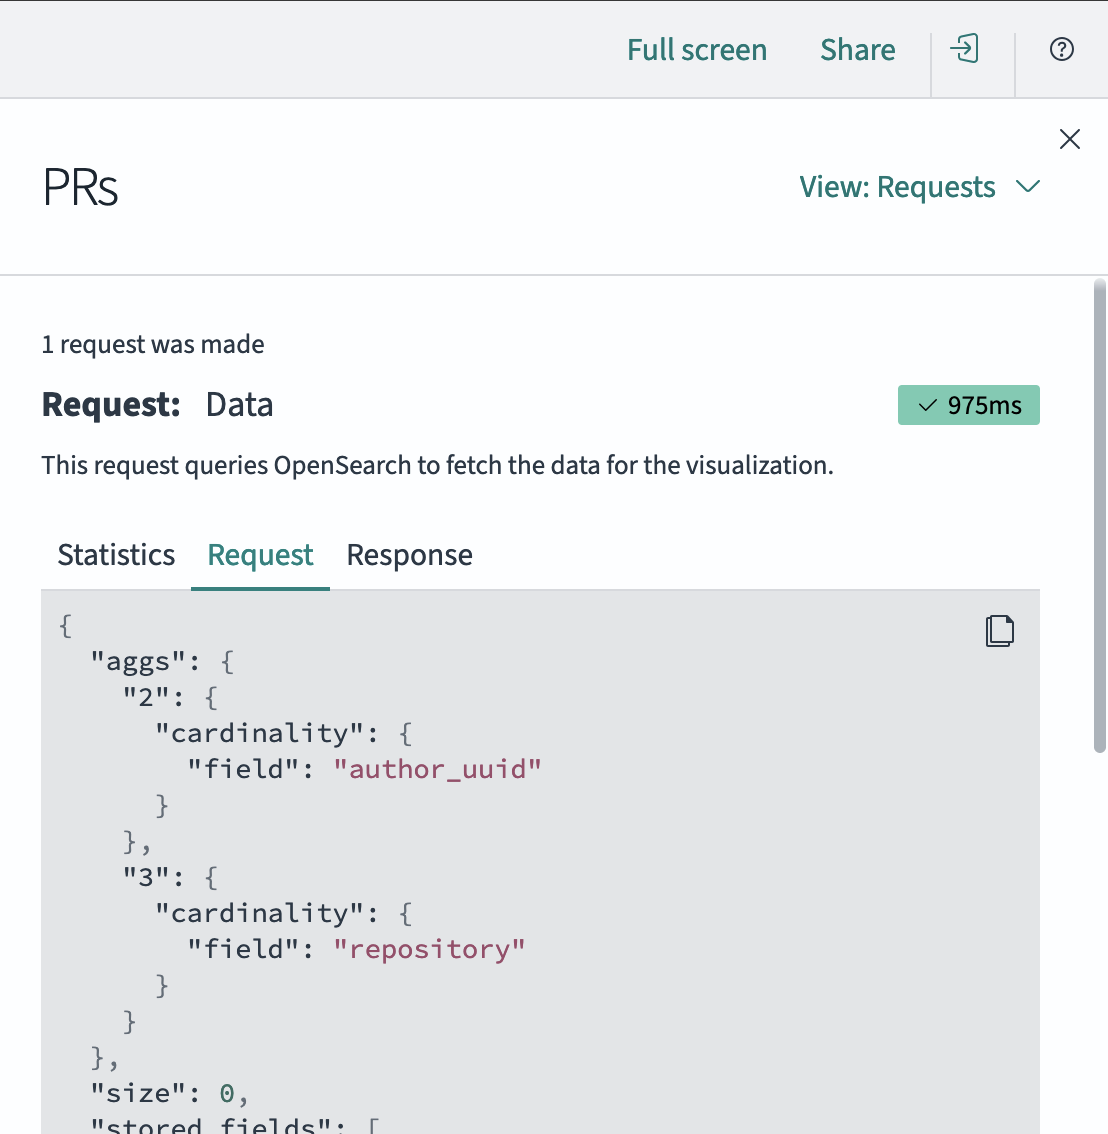
Share > Embed Code > Snapshot creates an iframe with the visualisation or dashboard, in the current state at the time of snapshot.Share > Embed Code > Saved object creates an iframe with the visualisation or dashboard, that will be updated.Share > Permalink > Snapshot creates a link to the visualisation or dashboard, in the current state at the time of snapshot.Share > Permalink > Saved object creates a link to the visualisation or dashboard, that will be updated.The dashboard can display the requests and results used for each visualisation. For this, click on the burger (3 dots) of the graph, select Inspect, then in the top-right corner select View: Requests instead of View: Data. The Statistics tab shows the OpenSearch index used, and the Request tab shows the actual request.


This request can be executed on the given index using curl (or any similar utility). Copy and paste the content of the “Request” tab into a local file (e.g. path/to/request_file.txt), and use the following options:
curl -v -X GET [--user ${user}:${password}] -L "https://eclipse.biterg.io/data/<index_pattern>/_search?pretty" -H "Content-Type:application/json" --data-binary "@path/to/request_file.txt"
A user/password can optionally be provided. Remember to set the <index_pattern> according to the value provided in Statistics, and to adapt the path.