Charts for its activity, namely commits, issues and reviews.
CSV files with the list of commits, submitted issues and reviews (PRs/MRs) over the considered period of time.
The project page
When selecting a project, either by picking one from the list or by searching in the search box, the following information is displayed:
About lists some basic information about the project, namely:
the project ID, as known in the PMI,
a link to its PMI page,
a link to its home webpage, if defined in the PMI,
download links for CSV exports of the activity data,
actual time ranges for data sources (time of first artefact and time of last update/activity).
the list of the repositories of the project that had activity over the considered period of time.
Activity provides insights about events (issues, commits, reviews) that happened during the considered period of time.
EMO lists information related to the Eclipse process for the project (WIP).
Security lists information related to the security management of the project.
Some projects have special tabs, depending on some characteristics - like their working group, for SDV projects
.
Charts
The following charts are generated for all projects:
The issues activity chart shows the number of monthly issue submissions over the last year.
The commits activity chart shows the number of commits on all branches over the last year.
The commits activity chart shows the number of commits on all branches over the last year.
Be aware that the current month is taken into account, meaning there might be a fall in activity if the chart is generated at the beginning of the month.
Charts for its activity (including all projects included in the working group), namely issues and commits.
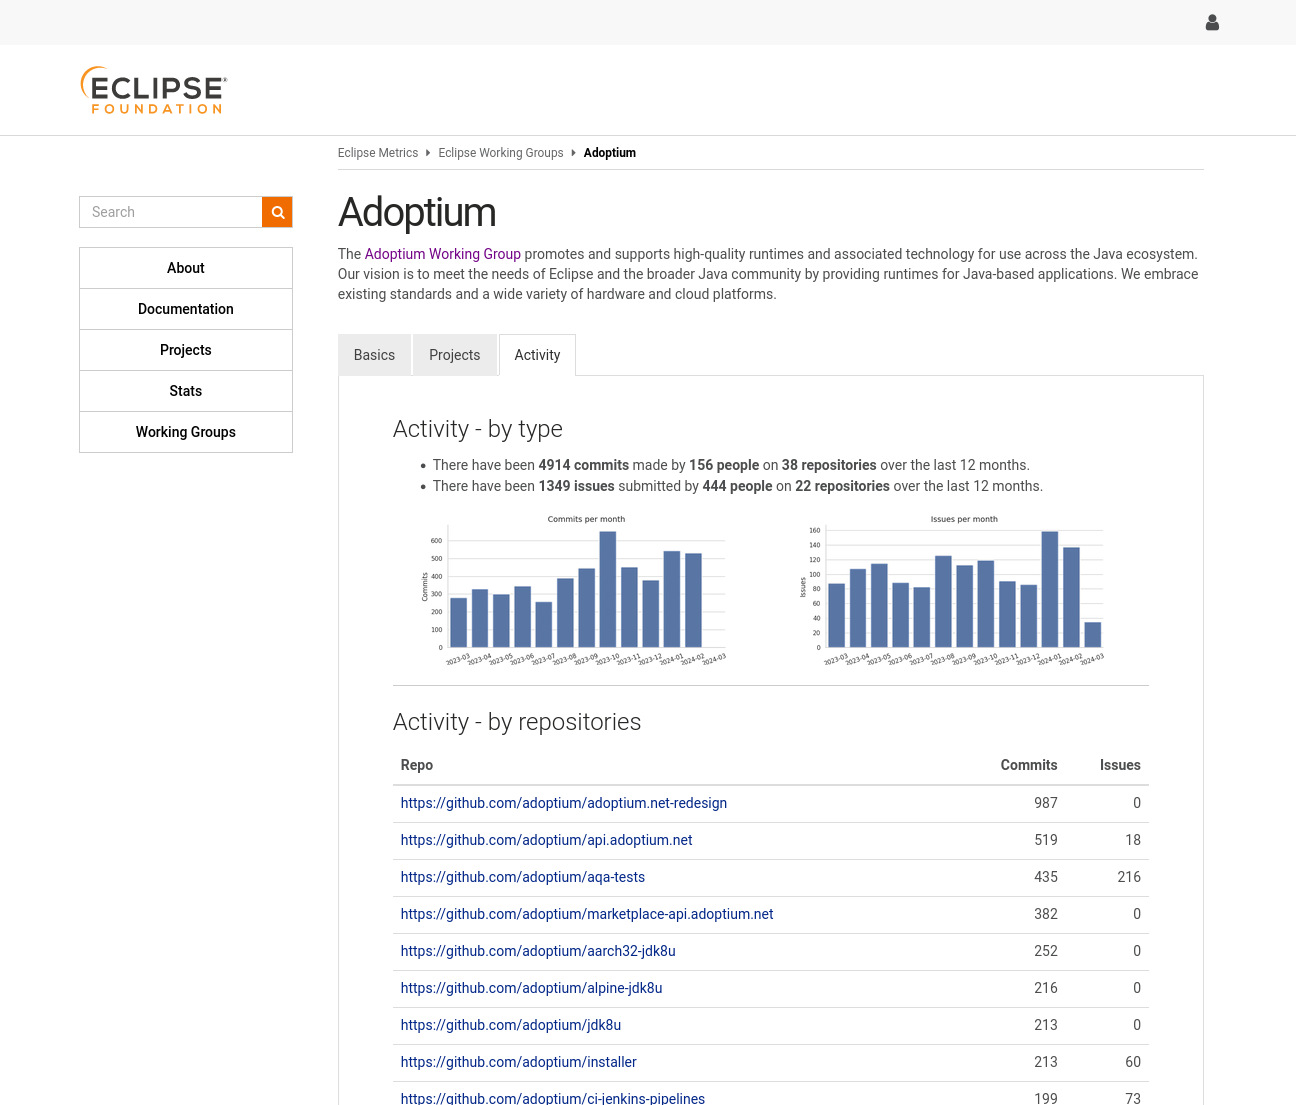
The working group page
When selecting a working group, either by picking one from the list or by searching in the search box, the following information is displayed:
Basics lists some basic information about the working group, namely:
Its ID and name,
The time ranges for the activity monitored (commits, issues), as extracted from the database over the considered time period.
The list of projects belonging to the working group, as defined in the PMI, with the number of commits, issues and reviews for each project over the considered time range.
The list of repositories with the number of commits, issues and reviews is displayed, sorted according to the number of commits.
The activity of the working group, including activity from all projects of the working group.
Charts
The following charts are generated for all working groups:
The issues activity chart shows the number of monthly issue submissions over the last year.
The commits activity chart shows the number of commits on all branches over the last year.
The reviews activity chart shows the number of reviews on all branches over the last year.
Be aware that the current month is taken into account, meaning there might be a fall in activity if the chart is generated at the beginning of the month.